All posts by admin

David Perkins – Teaching for Understanding

A good read about the importance of understanding, and the distinction between it and the gathering of knowledge and skills. Though these are important to education, Perkins talks about the notion of a “performance perspective”, meaning that knowledge gained needs to be able to be used in an adaptable way, and be transferred to other contexts and used to solve problems in other disciplines. This demonstrates proper, useful understanding which isn’t provided by rote learning.

Perkins argues that schools and teachers need to be aware of the importance of understanding, and its role in creating “generative knowledge”. This is knowledge that has value across multiple areas of the curriculum, that can be built upon by students as they encounter more reasons to apply it.

Good points are raised about how to achieve this level of good understanding in learners. Regular and appropriate assessment, a long term, holistic approach to learning, and familiarising students with the different methodologies appropriate to different subject areas all get a mention.

Teaching for Understanding

Knowledge Cartography

This is an interesting review on the practice of Knowledge Cartography, or mind mapping, and how it has evolved over a very long time to become a useful tool for the construction and sharing of knowledge and how mind maps, once made, can then be built on and discussed.

The main point is that when you externalise ideas in some sort of visual form, it makes you far better able to get a grasp on them. You can immediately begin to see connections between topics in a visual way, and there’s a sense of a bird’s eye view of your own thought processes. Also I think when you begin to create a mind map either on paper or with software such as Xmind, there’s a sense of needing to be organised and efficient with 2d, actual space, which seems to encourage the same discipline with thought processes.

It’s interesting that the point is made that the making of maps actually predates number systems and written language in our species. I’m sure it would be fascinating to trace the stages of how writing systems derived from the making of maps. I also found that the use of colour in some of the examples given really enhanced the meaning. The Argument and Evidence mapping used to study cases in courts used green for positive arguments, red for negative ones and orange for solutions that were found to counteract the negatives.

Knowledge Cartography
An attempt to map the article with Xmind

George Boole biographical notes

Biographical notes on George Boole for a poster design project. Taken mostly from Professor Desmond McHale’s biography “The Life and Work of George Boole”

George Boole was born in Lincolnshire in 1815. His father was a shoemaker who was self-taught in Mathematics and physics, and was particularly interested in optics. He made his own telescopes and microscopes, and instilled a great love of reading and education in his eldest son. A child prodigy, George was interested in all subjects; the arts and literature as well as the sciences. He made some translations of classical literary works from Greek which were published in the local paper aged only 14. As his father’s business failed, the young George had to take financial responsibility for his family, and aged only 19 he opened his own school in Lincoln. Early on he favoured a teaching approach where practice and working experience of a subject came first. When learning a language it would be spoken and read first, and only later on would he introduce the ideas of grammar and structure. Boole realised this is how we learn naturally as young children. Even in Maths he always taught using examples from real world problems and practical demonstrations and only later went into the abstract. He also fostered links and common approaches to the teaching of subjects which appeared unrelated at first. All of these approaches went against the grain of thought at the time, as the drilling of rules and rote learning would have been the accepted method. This made Boole a very distinguished and progressive pedagogue for his time. It’s thought a lot of this was a legacy of Boole’s father, who was also self taught and had an infectious thirst for knowledge and self-improvement.

Boole was also involved heavily in social issues. He set up and ran centres for the care and rehabilitation of prostitutes (prostitution was a big problem in Lincolnshire then) and he didn’t shy away from “moral education.”

Though his health began to suffer from a young age through the stress of his teaching position, his academic prowess continued to grow. An early highlight was his delivery of a lecture on Newton to the Mechanics Institute in 1835. Barely 20, he not only demonstrated a thorough grasp of Newton’s work, but significantly was not afraid to criticise aspects of his theories and methodologies. Brave and confident stuff for such a young man.

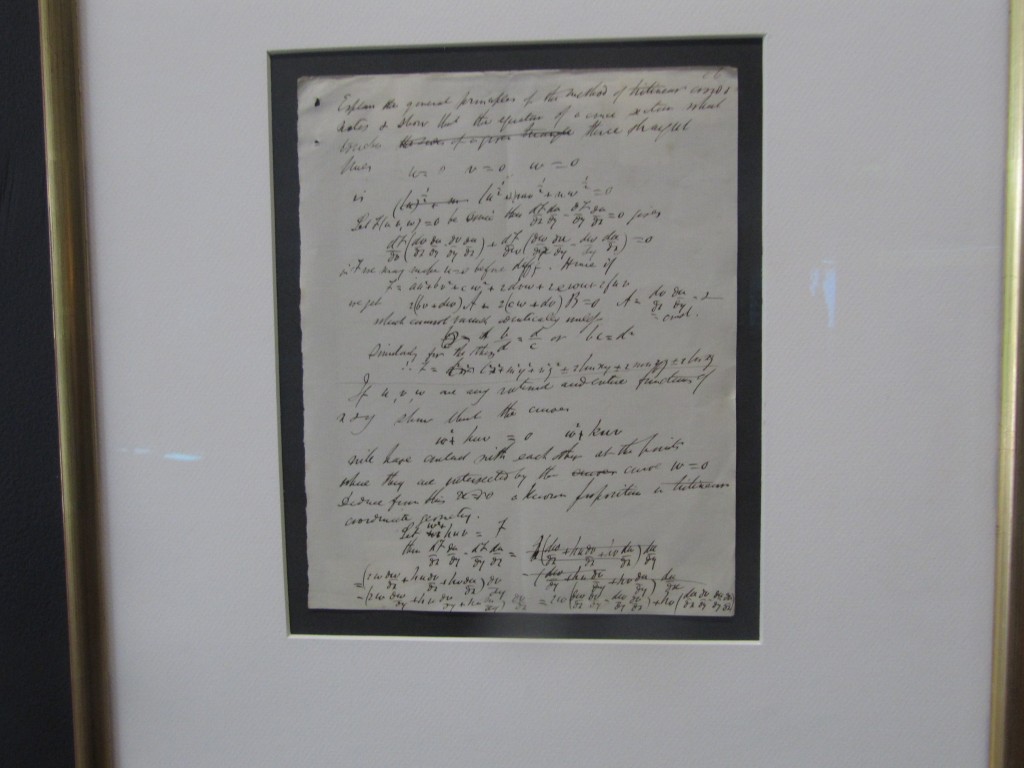
In 1844 Boole won the first ever gold medal awarded for mathematics awarded by the Royal Society, for his paper “On a General Method in Analysis” “Throughout the history of thought – from Aristotle to Leibniz, it had been the dream of philosophers and logicians to make of logic a precise science. That is to say, they hoped to understand the precise principles governing logical thought, formalise and symbolise them, and finally apply them in a more or less mechanical or automatic way to the analysis of a wide range of human, linguistic, ethical and scientific situations.” (p78) Boole’s interest in this came from several factors. As he’d spent much of his life teaching young children, he was very invested in gaining an understanding of the processes of the formative young mind, and how it learns to learn. Also, as a keen and versatile linguist, he was in a position to observe how language had developed different needs in different cultures, and how their differing structures developed to express various thoughts.

Boole, as a very religious man, felt the need to express the workings of the human mind in logical and mathematical terms, as he regarded the human mind as the creator’s ultimate work. “…his concept of God is perhaps best expressed as a personification of knowledge and understanding.” (p79) (There seem to be parallels here with the Islamic notion of geometry as the ultimate expression of the divine.)

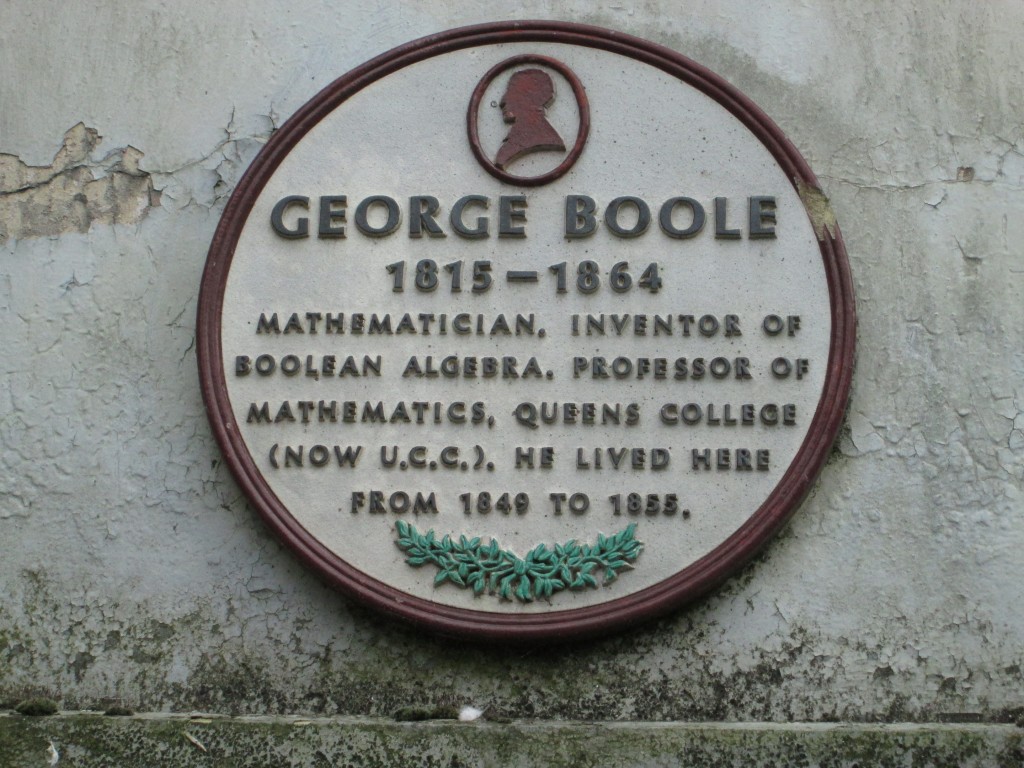
After a very long, drawn out application process, Boole was awarded a position in the newly formed university Queen’s College Cork (now UCC) in 1849. His father had recently died and his mother was old and infirm, but he ensured she was well cared for. The appointment was held up partly because the great famine was raging in Ireland at the time, and the setting up of non-denominational colleges in Cork, Galway and Belfast was controversial. Boole’s time in UCC was marked by a good deal of political upheaval; only two of the college’s professors were Catholic which caused controversy. Boole was very active on various committees, and was always very supportive and active on issues of students’ welfare and entitlement.
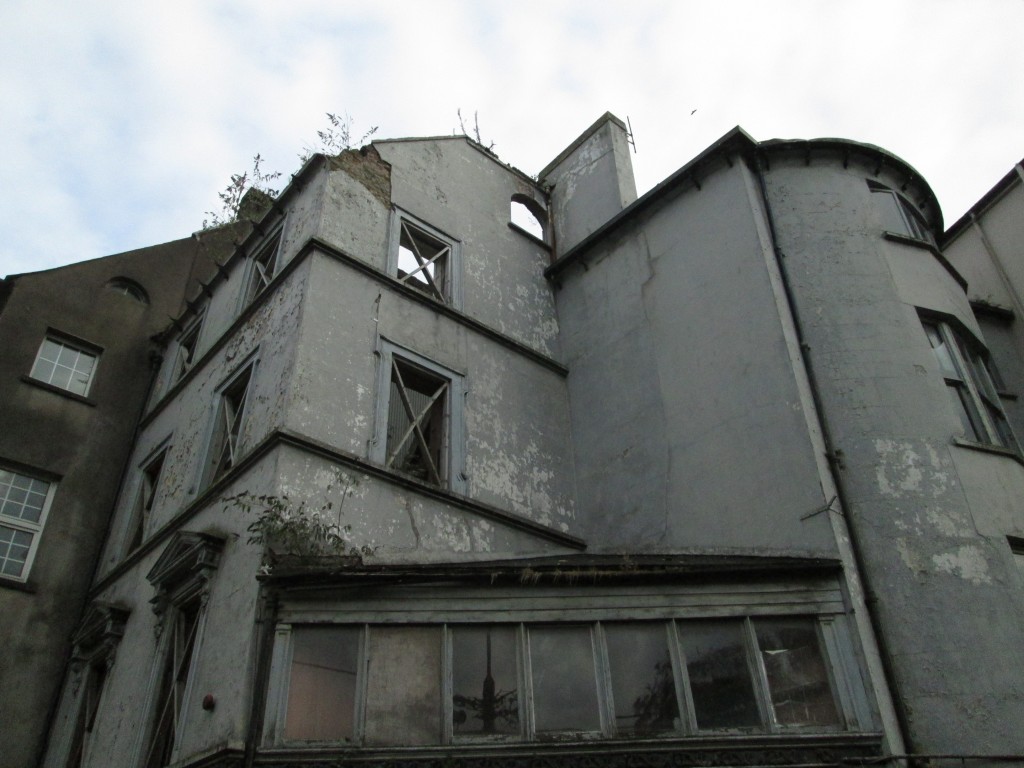

Boole was very active in the “Cuvierian Society for the Cultivation of the Sciences”, which was formed to educate working class people in science, literature and fine arts. They invited the people of Cork to attend regular lectures and exhibitions. Part of their remit was not to discuss issues of politics or anything “polemical”. Boole eventually became its president.

Logic – “the systematic study of the standards of good reasoning.” Aristotle was the first person to formally study and teach logic – it was initially developed to combat the proliferation of superstitions and myths which were so prevalent in the ancient world (that would never happen these days of course…) In place of these, the early philosophers sought explanations based on unaided reasoning and on observations that could in principle be made by anyone. Theories, and supporting evidence of them, were passed around and evaluated by peers. In this way they were either validated, modified and if not valid they were rejected. In short, rational explanations of the world were sought. Since it’s so difficult to decide which arguments are true and which are less valid or likely to be true, a way to study the universal language of reasoning itself was needed – pure reason no matter the subject matter. Boole wanted us to become better thinkers and reasoners.

In 1855 Boole married Mary Everest, niece of George Everest, after whom Mount Everest was named. They had five daughters (a reasonably improbable outcome – I imagine someone who devoted so much study to probability theory would have seen the irony.) They were high achievers, and include Ethel Lilian who would later write “The Gadfly”, and Lucy, who would become the first female professor of chemistry in England. Boole actually encouraged his wife to attend college and go to mathematics classes – she may have been the first woman to attend a university class in Ireland. Boole’s children were never allowed to indulge in babytalk, or “babyish corruption of language” as he called it. (p181)

Boole once invited an entire street band from Cork to perform in his garden.  (p182)

Beauty was an important concept to Boole, and he considered elegance to be an essential quality of good maths. Polya said “The elegance of a mathematical theorem is a quantity which is directly proportional to the number of independent ideas one can see in the theorem and inversely proportional to the effort it takes to see them.” (p195) “Boole used to say that however correct a mathematical theorem might appear to be, one ought never to be satisfied that there was not something imperfect about it until it gave the impression of also being beautiful” This is an interesting bit of insight into his character, as although he was clearly very capable of very advanced analytical thought, he also saw the relevance of an abstract, subjective notion such as beauty and saw the value of linking the two. This is borne out by the fact that even in his earlier school teaching days, he placed equal emphasis on the value of the arts as well as the sciences.

Boole wrote lots of poetry during his life, and although there were flashes of quality his works  generally weren’t exactly considered to be masterpieces. He seemed to be more interested in the structures and rhythms of poems, and sort of slotted the words in to fit. “Boole was a hard-headed realist who wrote (poetry) out of a sense of duty to his maker” (p210)

Interestingly, Boole was never made a member of the Royal Irish Academy, which is thought to be unusual for a mathematician of his calibre.

The number 1 and Boole’s religious beliefs. In the bible, the number 1 is regarded as being the symbol of God the creator. Boole interpreted 1 as the symbol of denoting a universal class, the class containing everything. Interestingly, Boole couldn’t bring himself to believe in the divinity of Jesus, a matter which caused him a great deal of personal conflict and even embarrassment. It’s thought that’s why he didn’t write a great deal about religion, so it’s difficult to be precise about his views on the matter.

He devoted a great deal of the last years of his life to differential equations, producing a textbook on the subject which is still considered to be a classic, “A Treatise on Differential Equations.” (1859) His wife Mary had been very instrumental in helping him develop the book, as since she didn’t have an expert understanding of mathematics, a chapter wasn’t considered to be finished until she declared herself able to understand it. It’s often thought to be a shame he didn’t devote more time to algebra as he would have likely made great strides in the area.

An interesting thought is that Charles Babbage made an “analytical engine” in the 1860s, which was an early form of mechanical computing device.  It’s fascinating to think what could have happened if Babbage and Boole had ever had the opportunity to work together. “With 20th century hindsight, it is fascinating to speculate what might have happened if the hardware of Babbage’s analytical engine and the software of Boole’s algebra of classes had been brought together.” (p266) Apparently, the engineering tolerances available at the time would have been accurate enough to enable the making of a very advanced computer for the time, and the information age could have happened much, much sooner.

In 1864, aged only, Boole became gravely ill with a fever after getting soaked in the rain as he walked to his lectures in UCC. Ironically, as both he and his wife were very devoted to homeopathy,  they tried to treat his illness using these treatments alone, and didn’t call a physician. He died  from this illness aged only 49.


Lucas, Gunawardena, Moreira – Computers in Human Behaviour

A look at the Interaction analysis model (IAM) which is a tool developed by Gunawardena, Lowe and Anderson in 1997. This tool is used to analyse the activity of students on asynchronous online learning tools such as blogs and discussion boards. The article assesses the IAM and its validity as a way to measure students’ learning experiences, and considers how it might be improved.

The issue of assessing quality of interaction as opposed to just quantity is brought up again as in the Community of Enquiry Framework. To tackle this, Peters and Slotta developed a method of analysing the changes students made to a wiki, but with a deeper consideration of the type of changes made, the particular types of files added, and whether the changes made were to a student’s own work or another’s. By differentiating between “peer” and “self” a picture emerges as to the levels of collaboration and contribution to the group, and some light was shed on aspects which may inhibit an individual’s activity, such as being overwhelmed by the amount of content on a board. (“Coding” the data seems to keep coming up in these studies, and seems to refer to how particular bits of information are logged under certain categories and how they are dealt with.)

To analyse knowledge construction, the IAM sets out 5 distinct phases of knowledge construction, each with distinct learning processes;

  1. Sharing and comparing of information – statements or observations, comparisons of knowledge etc.
  2. The discovery and exploration of dissonance or inconsistency among ideas, concepts or statements. Where students identify areas of disagreement and are forced to properly back up and reassert their positions.
  3. Negotiation of meaning/co-construction of knowledge. This is where common ground is sought, differences of opinion are negotiated and compromises to accommodate other’s views are found.
  4. Testing and modification of proposed synthesis or co-construction.  Where ideas proposed are tested against existing knowledge, or personal experience, to see what holds up and what doesn’t.
  5. Agreement statement(s)/applications of newly constructed meaning. What has been agreed upon and adapted or what has been rejected? What has the group learned from the process that they didn’t know before?

When using the IAM to assess a given discussion or blog, the information is broken down and is assigned to one of the above 5 groups. Ideally, you want to see a lot of students’ contributions getting to the highest numbers on the scale. This didn’t happen though – in several studies of groups of teachers and students, the vast majority of posts were in Ph1 and a few in 2 and 3, with little or none at all in 4 and 5. This was explained by participants essentially feeling inhibited by the need to be polite to people they perhaps didn’t know and not seem controversial, or by being very self conscious if they were being assessed and monitored. In the case of students who met regularly in other classes face to face, it was thought they simply didn’t need to interact online. The big exception was a group of women enrolled in an educational technology course in Korea (Preaching to the converted..?) Also a postgrad course on Multimedia in Education in Portugal scored much higher in the later phases.

The lack of engagement in the higher phases was discussed, a lack of experience on behalf of the moderators / instructors was highlighted, for example in the setting of tasks and questions the students would be likely to willingly contribute to. Also, cultural factors were at play – studies in Taiwan and Singapore suggested that students were not comfortable with the dissonance aspect of the interaction, but were able to reach forms of resolution without it. This suggests that the (western) notion of needing robust debate and challenges to ones deeply held beliefs to learn may not be so valid.

Garrison, Anderson, Archer – Community of Enquiry Framework: a Retrospective

This is a report on the findings of the Community of Enquiry, set up in the nineties in the University of Alberta by the three authors, to investigate the then recent idea of graduate programs being delivered online, with an emphasis on discussion and debate taking place in discussion forums. They were delivering a graduate program in Communications and Technology, so it was a pretty apt study given the context.

Social presence, cognitive presence and teaching presence were the three main elements identified by the group as being vital to the process of successful online learning. The online communication was text based and asynchronous. This was in the sense that a face to face classroom or video conferencing situation is synchronous, where people present are able to directly respond to each other. They were very interested in the pros and cons of both approaches, against the perceived background that too much of the learning experience was lost in the asynchronous approach.

There was an extensive study of the transcripts of students’ discussions in order to tease out how these different presences were working together to give students a well rounded and rewarding educational experience, in order to see how this experience could be improved. There is a long description of how exacting they were in analysing the data they got, most of which is scarily complex. I was very struck by their use of the phrase “unit of learning” and their attempts to define what that might even be. It seem it’s easy to quantify how many words or posts a student has written or responded to, but not so easy to quantify exactly how much “stuff” was learned. Quantitative analysis is a lot easier to do than qualitative analysis it seems. This issue prompted them to examine those difficulties specifically in another study. The study seems to have been very influential, having been cited over 600 times in scholarly publications at the time of writing.

Lev Manovich – Data Stream, Database, Timeline

The invention of interactive graphical computing in the 1960s enabled displaying the same data in various ways on the computer display. The user experience of the data was no longer dependent on how it was stored (files, relational databases, object-oriented databases, etc.) (More precisely, we should say that the physical representation of data, its logical representation, and its user representation became separated.) In addition, the display could now be updated dynamically in real-time. This added more possibilities for displaying data. – This is an interesting point to consider today, that only a few decades ago we weren’t able to change how information was presented to us, but now it’s taken for granted that we can edit, resize, crop, search, refine and curate our information however we want. I suppose it gives us a feeling of greater involvement and ownership over the data we use.

Manovich talks about the idea of databases and how their use developed over time with the development of the World Wide Web and ever more sophisticated tablets / smartphones and the increasing importance of social media. Even though users could organise their viewing experience how they wished, and the information websites contained was updated periodically, the experience was still a collection of largely static icons and hyperlinks.  Now, we experience much of our information through “data streams”, where the info constantly comes at us in a single column, newer items pushing out the old, – The most important event is always the one that is about to appear next because it heightens the experience of the “data present.”  This is interesting from a psychological point of view, since it’ll keep the reader permanently compelled to connect with his data streams as often as possible. It would seem to me to be almost akin to an addictive form of behaviour.

M likens this experience to the concept of the flaneur, who would wander around the environment of his choice, stopping where he pleases to take everything in and observe. By deciding where to be and when, he can control how much stimuli and information he’ll receive. We do this on social networking by deciding which people and groups to follow, how often to check in etc.

M refers to an installation installation, Listening Post by Mark Hansen and Ben Rubin (2002) as an artwork which has attempted to deal with this phemonenon.

This is the museum’s blurb for the exhibit – The installation Listening Post by Mark Hansen and Ben Rubin analyzes all the text—typed just moments before—by tens of thousands of people in Internet chat rooms around the world. It presents them as six different “movements,” combining musical tones, sound effects, synthesized voice, and scrolling text.


The YouTube clip on this is interesting; from the blurb I was expecting a sort of cacophonous, overwhelming din, but the effect of the piece is strangely soothing and meditative. The wall of displays is arranged in an arc around the viewer, which I imagine would give a real feeling of encapsulation, maybe even the comforting sort. However, the viewer is free to walk behind and outside of the installation area too, much like the choice we have to get out of the data stream If we wish.

All of the audio snippets of the chatroom begin with “I am”, presumably from many different individuals, but the synthesised voice speaking all the lines homogenises the contributors, putting them on all the same level, regardless of their location, circumstances or emotional states. This actually gives us cause to really consider the anonymous, faceless people involved, and wonder who they might be, and why they’re there.  An unexpectedly poignant piece of work.

What’s next: The Radical, Unrealised Potential of Digital Humanities

Miriam Posner from her talk at Keystone Digital Humanities Conference in Pennsylvania, 2015

How might the Digital Humanities crirically investigate structures of power like race and gender?

we’re asked to consider what other forms of visualisation there might be for maps for example. Google Maps might seem to be novel even now with the level of detail and complexity, but is still a representation of a spherical surface on a 2d plane, a map in the tradition of empire builders of the past. The example is given of Aboriginal bark paintings, one is of a crocodile but on it is written the names of different types of land, so can be considered a map of a very different kind.

“The Changing face of America” was a grid of faces which when you clicked on an individual person would display detailed info on the person’s ethnicity and background, far more detailed than a simple census description of “black” or “white”. Because of the power structures of race and gender which we have, data gets flattened into over-simplified categories and we need types of visualisations which challenge that.

An examination is then made of several projects which have been challenging these old modes of data presentation.


Zotero Introduction

Allows you to capture and save references.

Evernote is good for keeping your notes, and sync them between your devices. You can attach tags or documents to notes.

Zotero is a better solution.  Installs as a plugin for browsers. It allows you, when on Google Scholar, to bring up a list of items on the page, select what you want and it’ll add the info to a folder, with all the bibliographical details it can find. You can then get it to create a bibliography in a format you choose.  You are also able to add notes or tags. It will also sync the information to all of your other devices .

In Word or Open Office you can also get an add-on to add footnotes to your documents.

Monica Colon-Aguirre “You Just Type in What You Are Looking For”

Interesting study by Monica Colon-Aguirre and Rachel A. Fleming-May on the study habits of 21 undergraduate university students in the US, who were enrolled on a number of different courses. They were comparing the students’ use of Wikipedia and other free web based resources with their use of the university library, both physical and in digital form. It was generally found that the students who were very comfortable with using the college library, and would prioritise it over online resources,  were in the minority. These were termed “avid” library users, though they admitted to often using Wikipedia etc. as a starting point to research.

There were two other categories; occasional library users and library avoiders, who suffered the most from “library anxiety” (I’m glad somebody’s given it a name.) Most of these students admitted to only using the library when their tutors expressly ordered them to and demanded evidence of it. And then they found the library an intimidating experience, difficult to navigate and confusing. While all students recognised that the libraries resources were likely to be more reliable and of better academic quality, the attraction of Wikipedia and other search engines was their accessibility and ease of use, and the fact that when you looked for something, typically you  just found it.

The authors make the point that when it comes to designing libraries and databases, maybe this ease of use should be taken into account, as it was the quality most valued by the students. The role of library instructors was taken into account as well, as many students found them a great help in easing them into the library experience. It’s suggested the library staff could liaise with the tutors in order to come up with more successful ways to prescribe research material in a less off-putting way.

This was an interesting read for me, as the last time I wrote a research paper a couple of years ago we were told in no uncertain terms to stay away from Wikipedia as a research tool. Or if we did use it as a starting point to at least have the decency to keep it quiet. This is a much more balanced approach, which tries to understand why the use of Wikipedia is so ubiquitous and challenges colleges to learn something from it.

Another point coming from this article is the lengths the authors go to describe the methodologies of the entire process, from the way in which the students were selected to take part, the conditions under which they were interviewed and how the data was gathered and analysed. it would seem to be a good example of how thorough you need to be to conduct good research.

Old Skule New Rules

An overview of developments in teaching and some current buzzwords. Old method to pursue an academic career was you’d get your own qualification and stand and talk at people for an hour so they’d absorb all the knowledge.

People in many careers are expected to be educators now, not just in standard classrooms but there may often be an educational aspect to working in say a gallery or museum.

Learning outcomes define what the outcome of the course should be and need to be appropriately tested for. TPACK is a map of things you need to know about. Content Knowledge everybody knows some of, but the other two things are Technology and Pedagogy, which need to be built on. Salmon & E-tivities – online learning activities where you get people together online and build a community first, and then get them to contribute to a shared system of learning.

Flipped classroom – from sage on the stage to guide on the side. Transfers agency from teacher to learner, teacher surrenders some control but result is better. Readings and videos are prescribed and class time is used for discussion. A blended model, face to face and tasks.

Personal Learning Environment PLE. How do you build that, tools, people, everything that you use to keep informed of your field.

Research based learning. Used to be telling of a story by an academic. Now students are involved in carrying out the actual research, more hands on.

Seek, Sense, Share. How you acquire and filter out your knowledge and make sense of it, then add value to it and give it back out to the community.

Teaching for understanding. Performances of understanding and ongoing assessment rather than a big test at the end. Generative topics that produce new questipns as the students go along.

Communities of enquiry, building learning communities. Foregrounds discussion – trigger, exploration, integration where you draw things together, and then resolution.

Threshold Concepts. Something that changes how you understand a subject once you’ve mastered it. The Eureka moment, where a little light went on.

Transformative learning is related to this, where the student gets to a level of understanding that changes fundamentally how they think about their subject.

PAH Pedagogy, Andragogy, Heutagogy, deals with regulating and directing your own learning, taking responsibility for your own learning.

Knowledge Management. Writing down how to do things, so someone else can do it. What do we know and how do we combine it with other knowledge to solve issues in the future. A business model.

Critical Pedagogy. How does learning work and how can it be improved. Educator as the lead learner.

All these topics are designed to contribute to more Meaningful Education. Prepares learners for a world which is VUCA – Volatile, Uncertain, Complex, Ambiguous.