Category Archives: Art & Computers

Digital Arts Project

For my digital artwork for this module I chose to produce a short video piece based on the theme of surveillance, a very apt suggestion by one of my classmates. The starting point was a selection of small sculptural models I’d made previously while testing out potential ideas for larger works.

some wee models

These were vaguely architectural in style, and I began to make models of them in Sketchup, a free 3d modelling program used to make the models of buildings found in Google Earth.

finland1

Sketchup allows you to import imagery to texture the models you build, so I photographed the surfaces of the actual pieces and after a little Photoshopping for consistency, applied these to the models.


When the models were built I did some copying and pasting and created a sort of quasi-futuristic (or something) cityscape out of them.

Finland art test11

Sketchup has some useful tools for exporting video footage of the assets built within it, so I experimented with those to simulate the panning of security cameras back and forth from several different viewpoints. The finished video is below.

Narrated Visualisation – Russian Modernists


While considering a subject for a project on data visualisation, in order to make the research as relevant as possible to my overall course objectives, I decided to focus on three prominent Russian artists of the early 20th century. Kazimir Malevich, Vladimir Tatlin and Alexander Rodchenko were all important figures in the Russian avant-garde movement of the 1920s. Each working in a variety of art disciplines, generally in the style of geometric abstraction, their work has been highly influential on many artists in the west throughout the 20th century, and they have been the subject of a considerable amount of critical writing outside of Russia. In order to trace the trends of the writing that exists about these artists, I used Google Books Ngram viewer, Google’s online search engine that allows users to search for the frequency of occurrences of particular words in a given language.

The diagram above shows the results of a search for the three names, in the English language corpus, from 1920 (roughly when they first became prominent) to 2008. The graph shows a pretty steady increase of references to all three and then a tailing off, with Tatlin and Rodchenko being particularly equivalent in pattern. There is a marked peak for both around 1990 – 1991, probably related to the collapse of the Soviet Union at that time, which would have afforded Western academics increased access to their works. Also after this point many works from all three artists would have been allowed to travel abroad for the first time in decades to galleries in Europe and elsewhere, generating considerable interest. Another reason for the similarities in Rodchenko and Tatlin’s graphs may be that they were both associated with the same movement, Constructivism. Many books have been written about this specific movement and both would very likely be referenced in such works.

Kazimir Malevich has followed a somewhat different trajectory, remaining a prominent subject for discussion well into the 21st century. He is associated with a separate movement, Suprematism, in which he is by far the most notable figure. He was himself a prolific writer, and among the reasons for his increased popularity may have been the publication in the late 1990s of several volumes of his writings with English translations. There was a major exhibition of his work in Paris in 2002, followed by major retrospectives in Berlin and New York in 2003 and 2004. Such exhibitions generate a good deal of attention and renewed critical writing. In 2014 the Tate Modern gallery in London held a very sucessful exhibition of his work, so his prominence is likely to continue for some time.

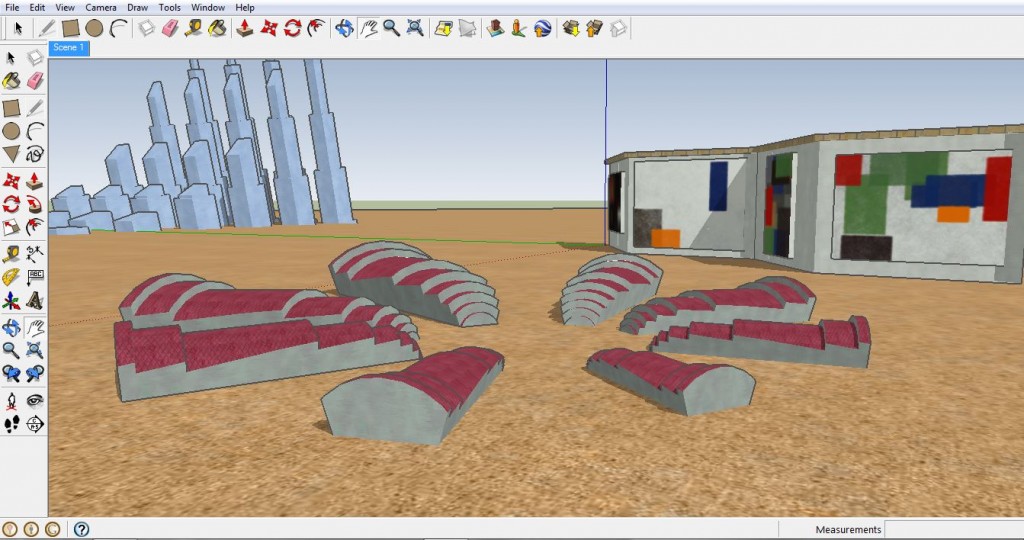
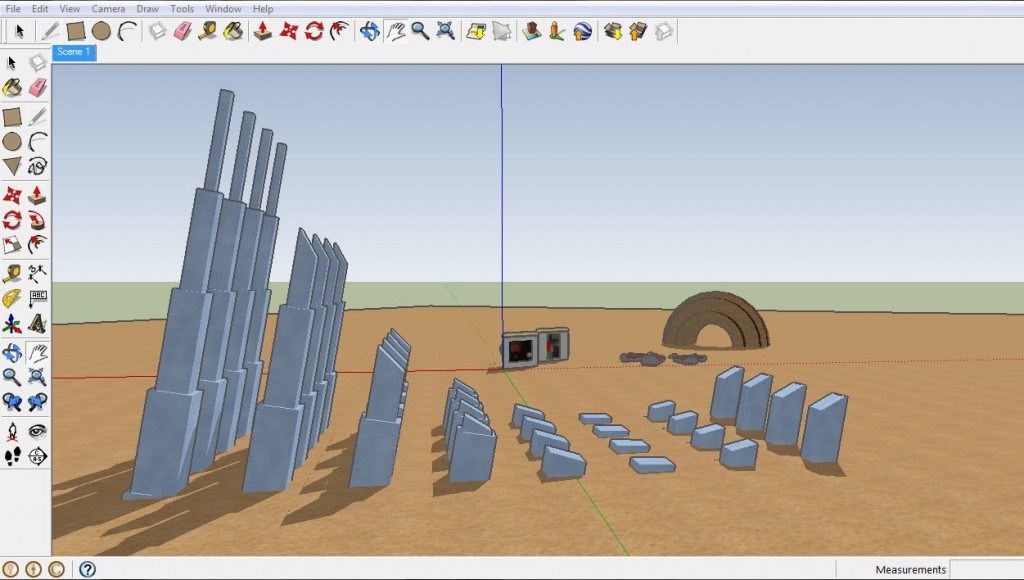
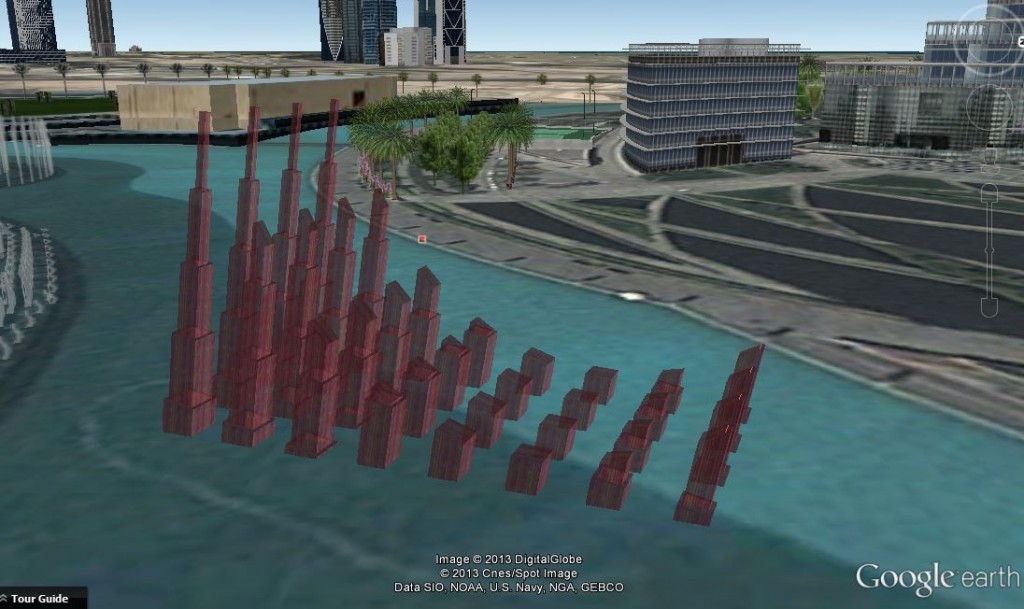
I wanted to experiment more with the data from the Google Ngram Viewer. While it’s a great source of information and a very useful tool, I wanted to be able to play around with how the information looks visually, especially given my interest in fine art and aesthetics. There are many good tools available for data manipulation, but I was keen to try a more hands-on approach, so I decided to use the open-source programming language Processing, specifically developed for coding within the context of visual arts. Since my dissertation is likely to heavily feature its use, I also needed to gather more experience with it.

Malevich & pals 1

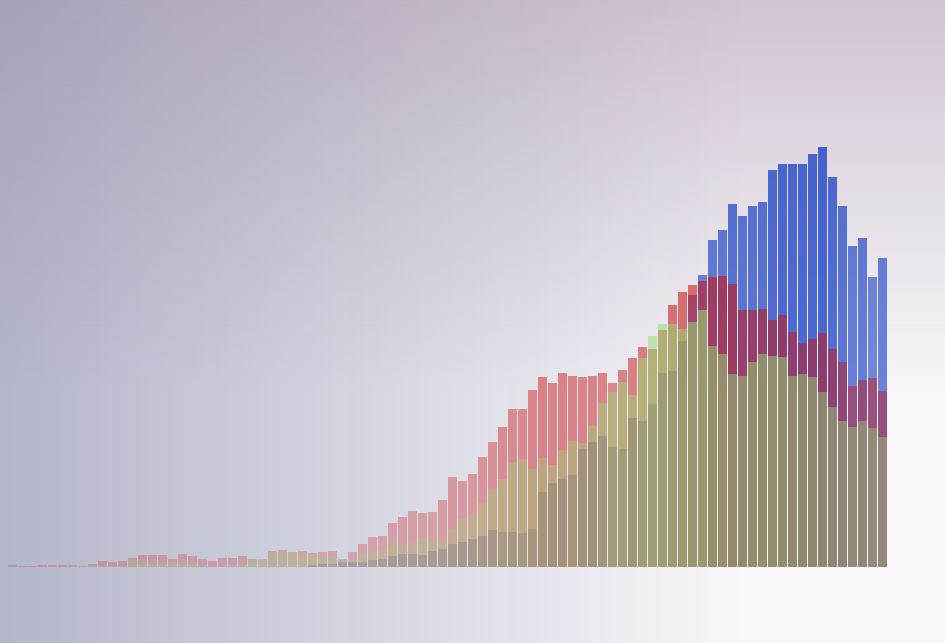
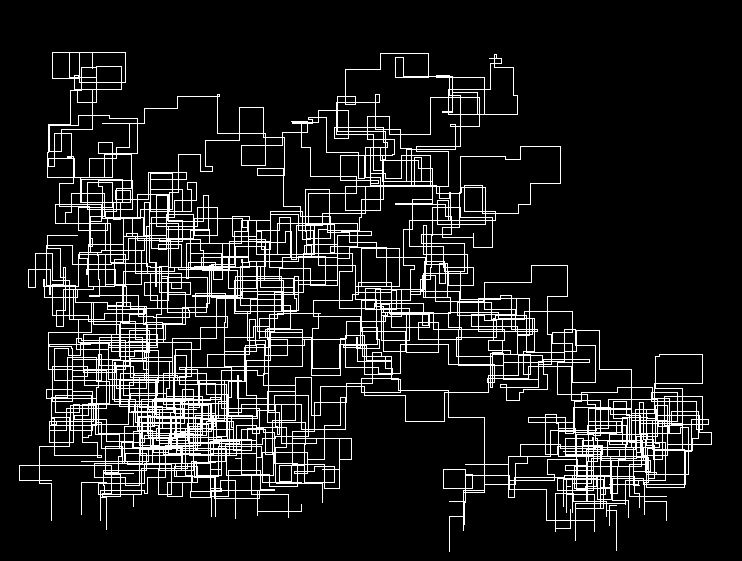
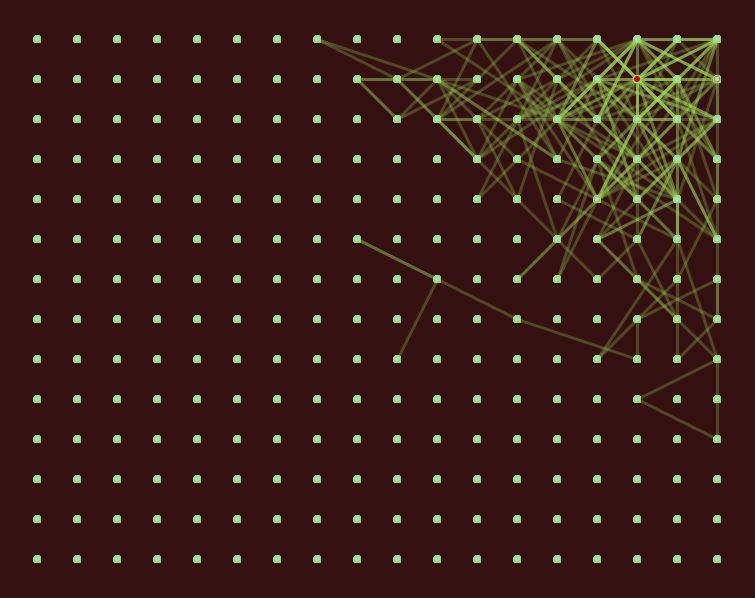
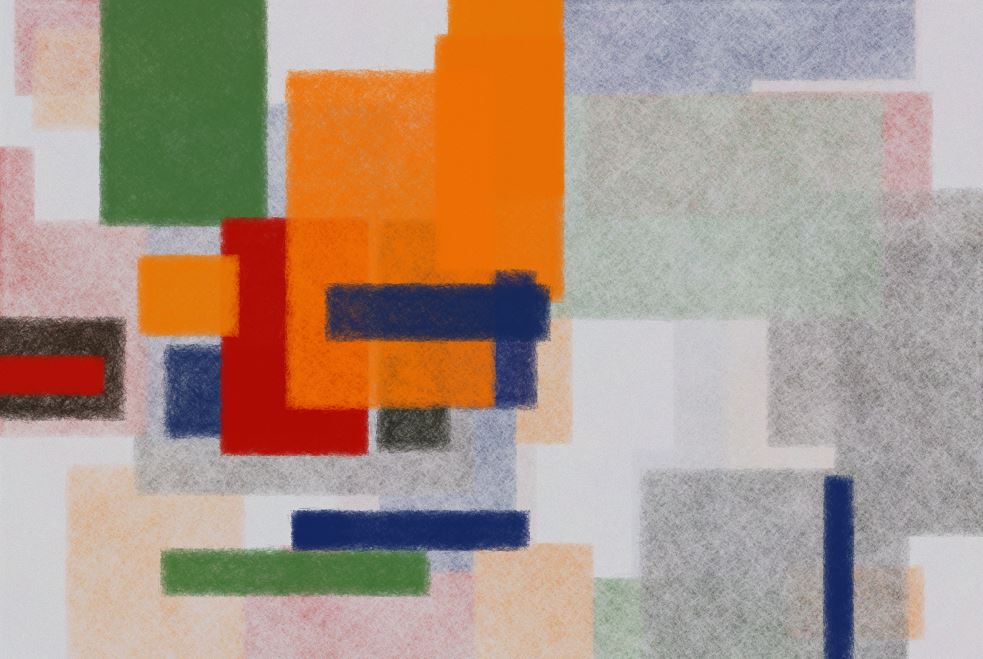
The above diagram was generated with Processing, and contains the same data from the ngram viewer with a different visual approach. The first task was to get hold of the raw data from the graph. Google Ngram Viewer doesn’t appear to have any means to be able to download the data from an individual graph, but I discovered that by viewing the source code of the webpage, the data existed as a distinct array for each search term on the graph. I was then able to insert the information into three separate arrays in my own code. This was a useful exercise as I hadn’t used or written an array before, and I understand the use of arrays will be important to produce sketches with good quality interactivity as I intend to do.

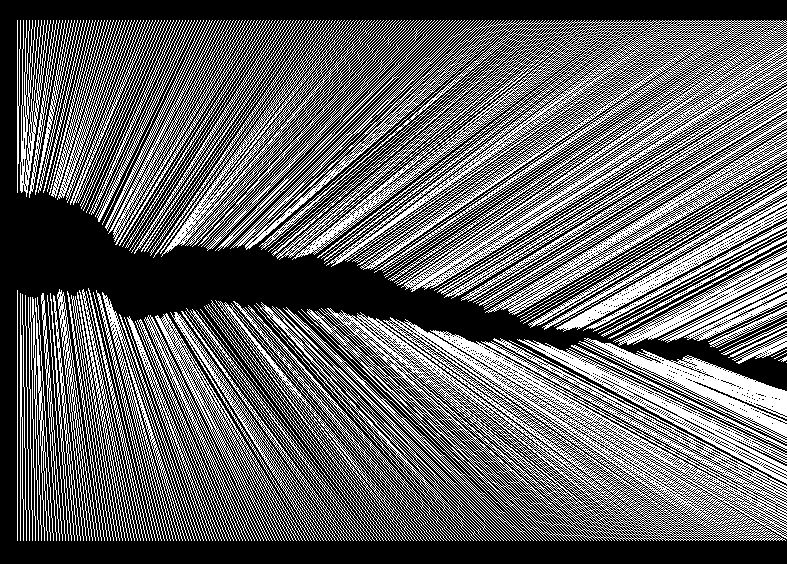
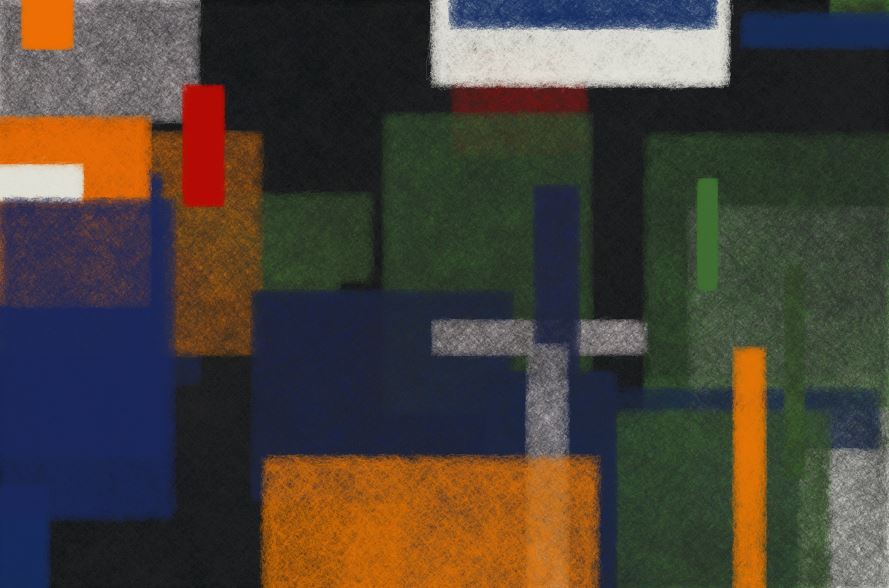
I used the data from the arrays with a for loop to draw the bars with varying length. For clarity, I retained the same colour scheme for each artist used on the Google graph, though I adjusted and desaturated them for aesthetic reasons. I also tied the opacity of each bar to its length, so the colour fades out with lower values, allowing the ones behind to be seen. This also produced a subtle modulation of colour across the graph. Finally I added a couple of for loops to produce gradients in the background for a little more atmosphere, and to contrast with the rigid geometry of the bars.

Malevich & pals 2

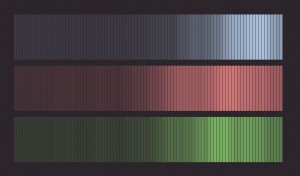
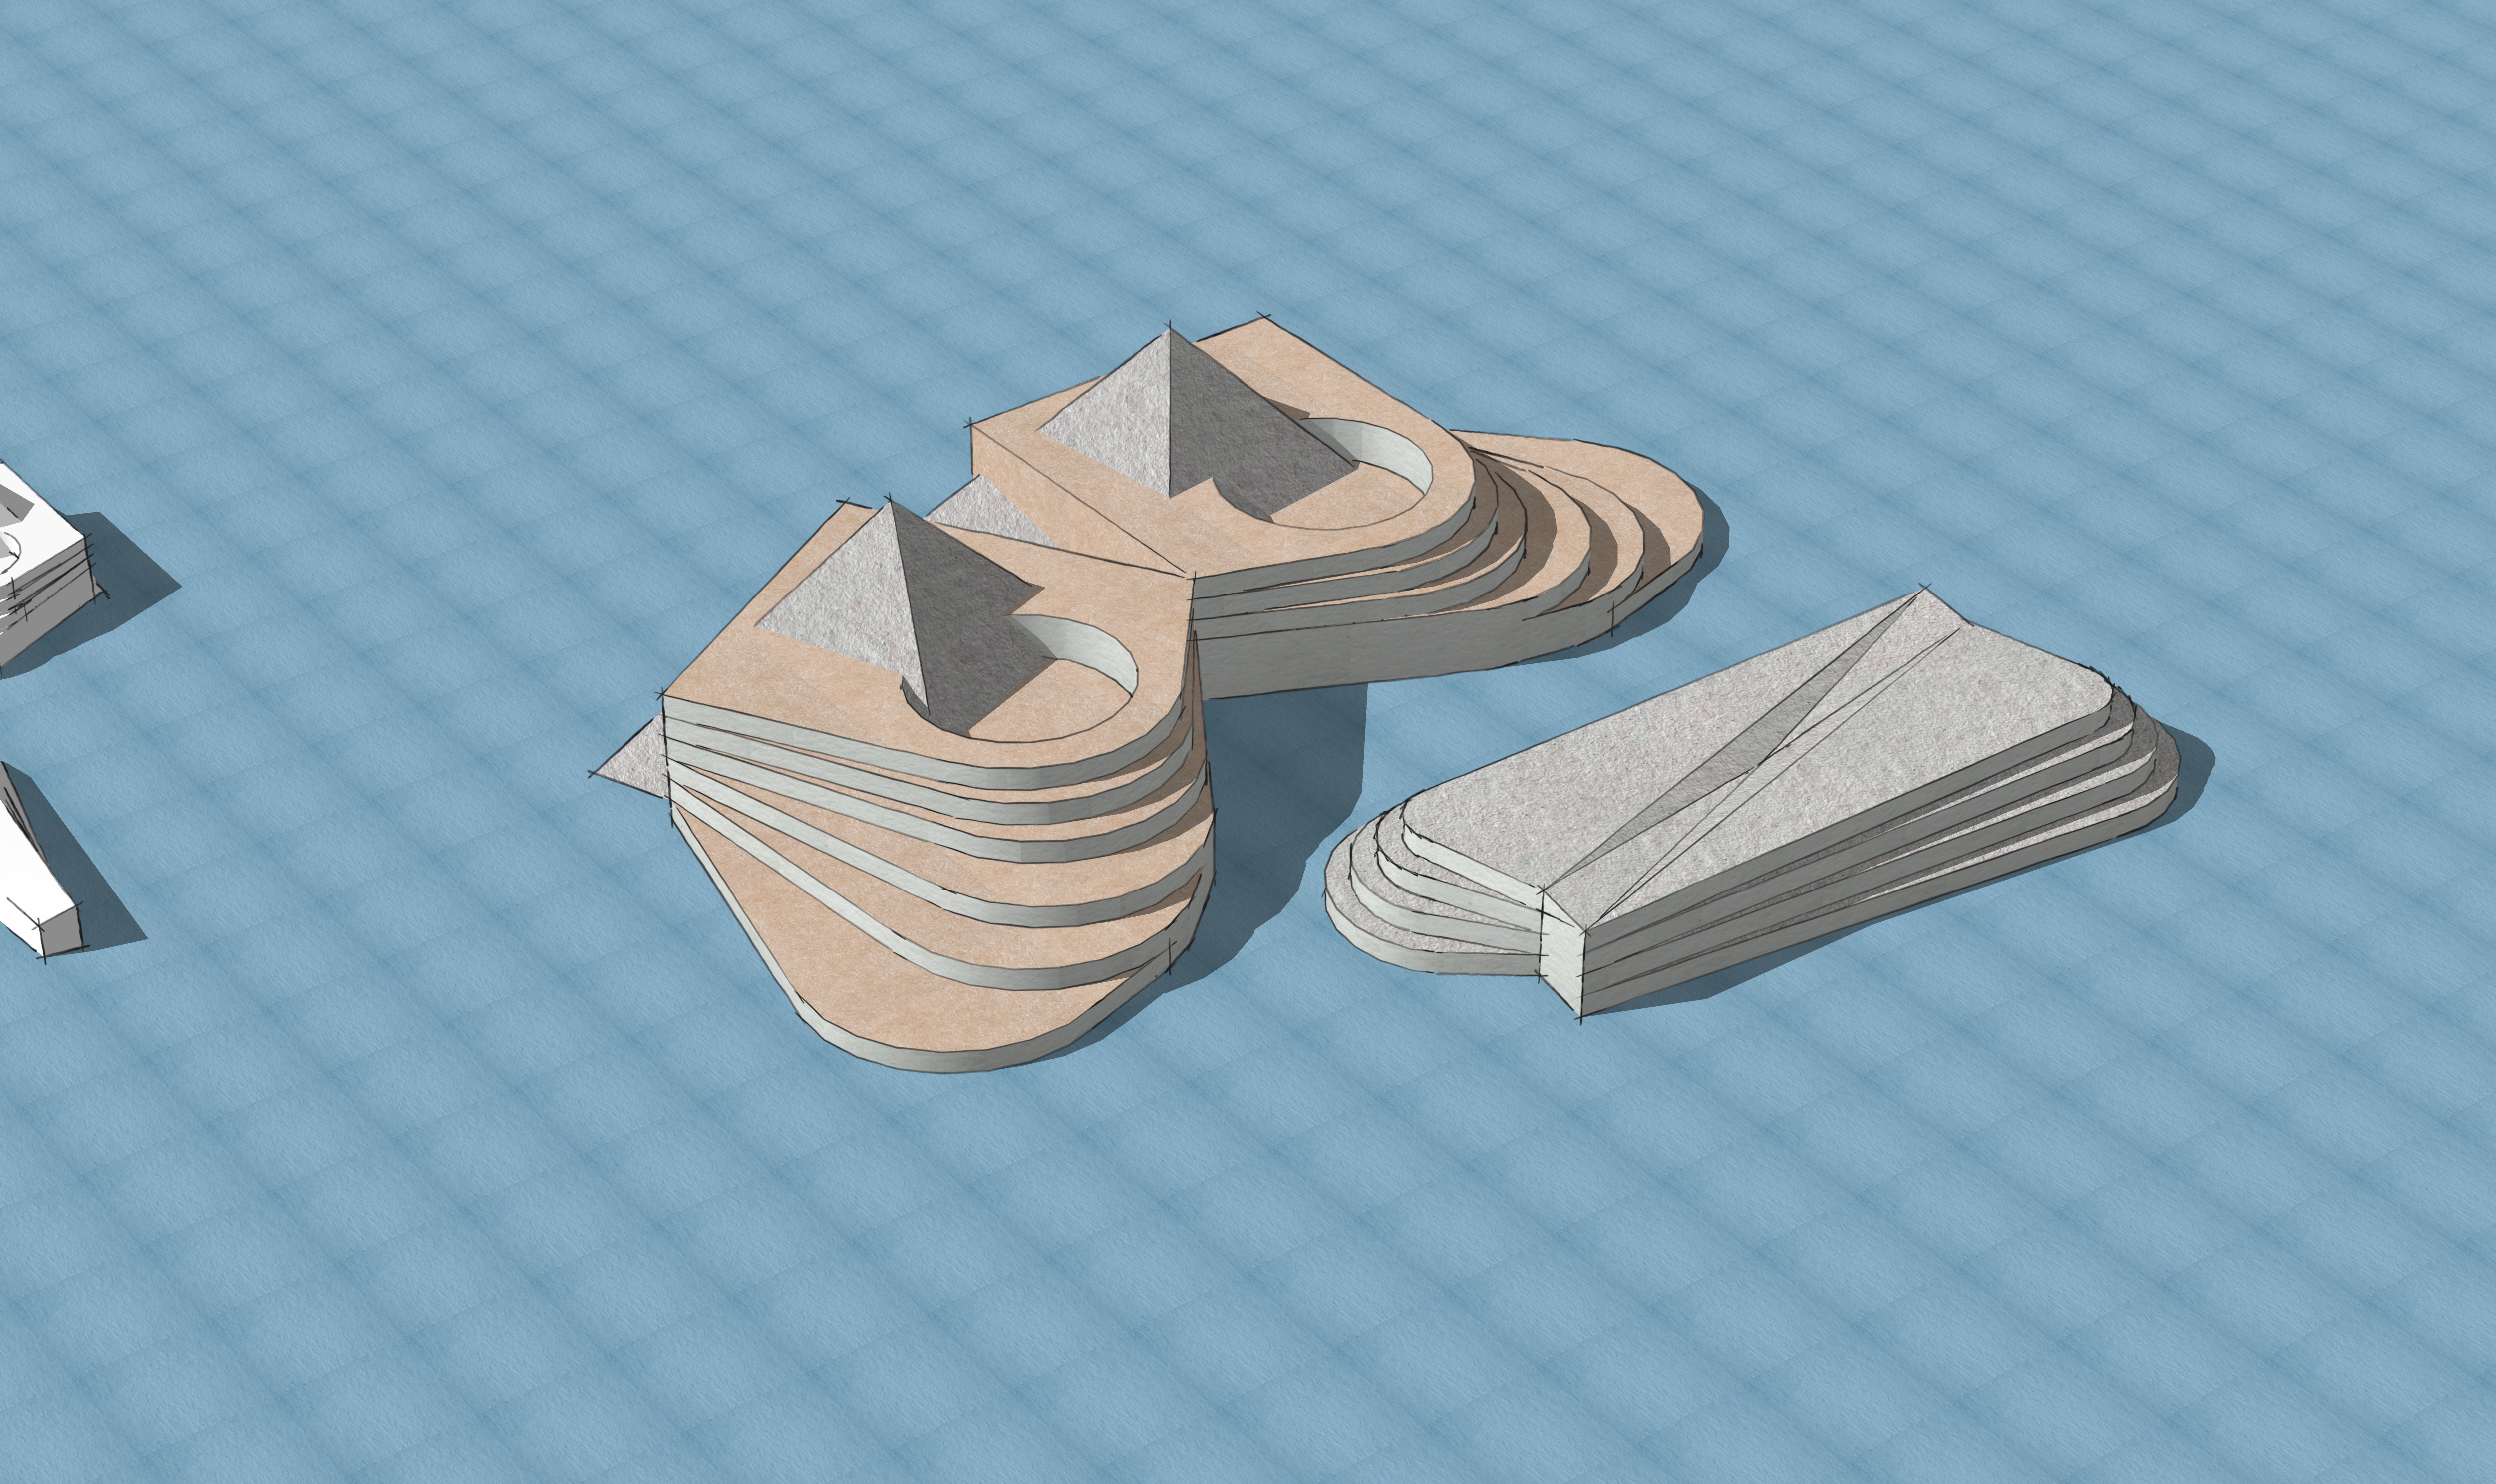
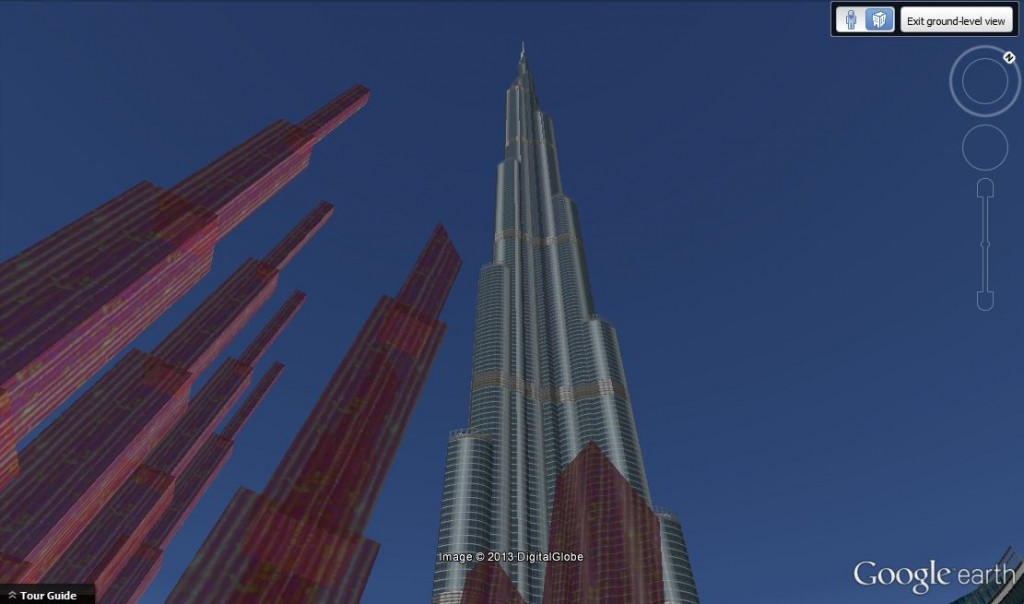
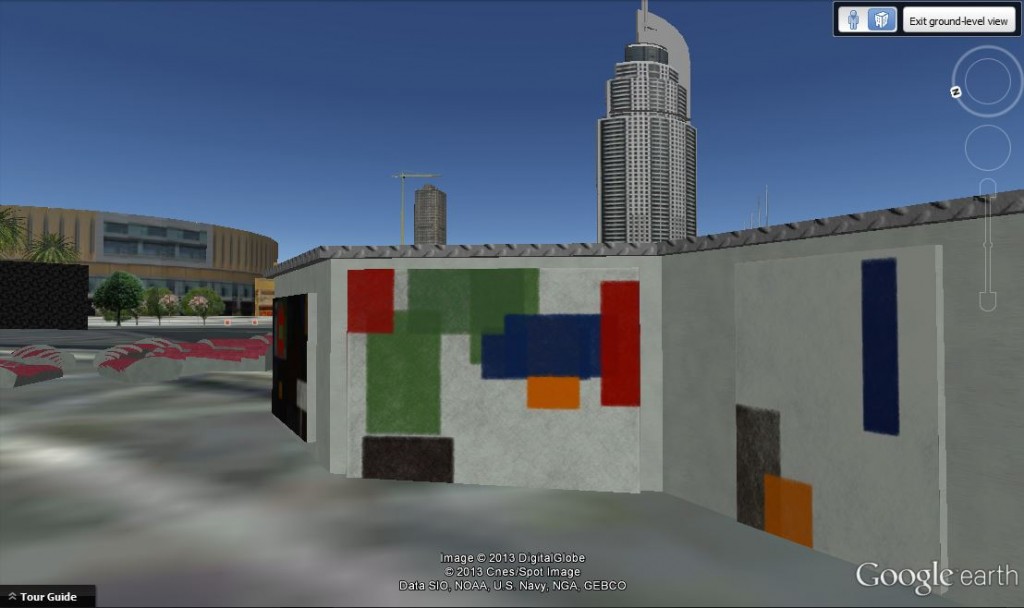
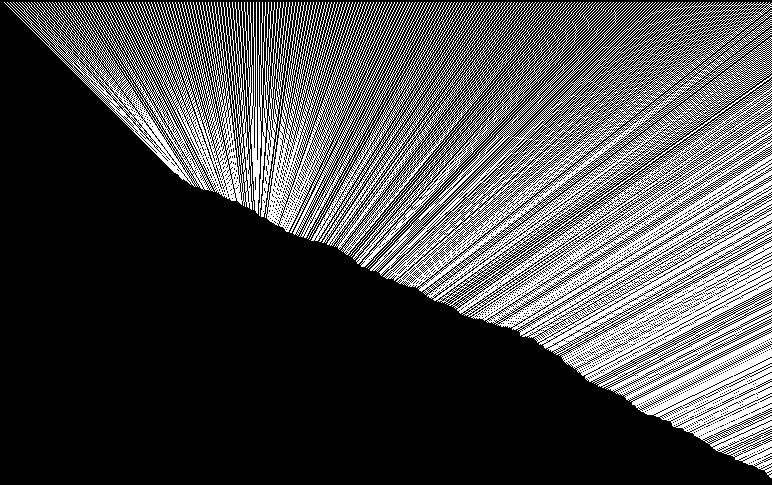
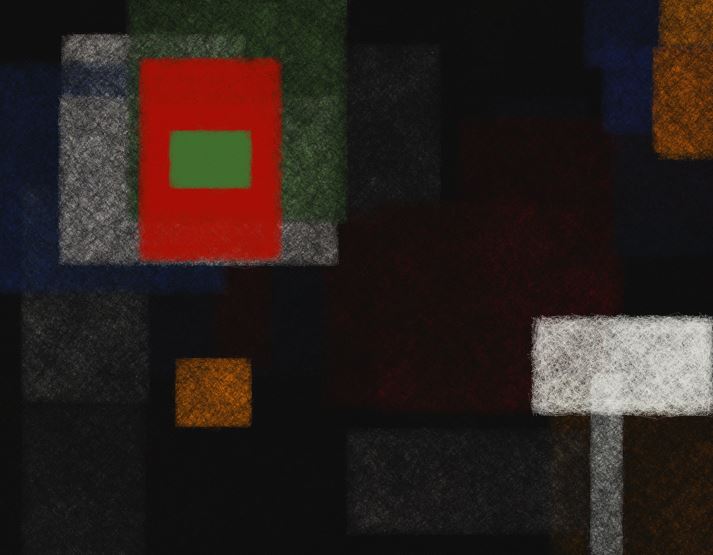
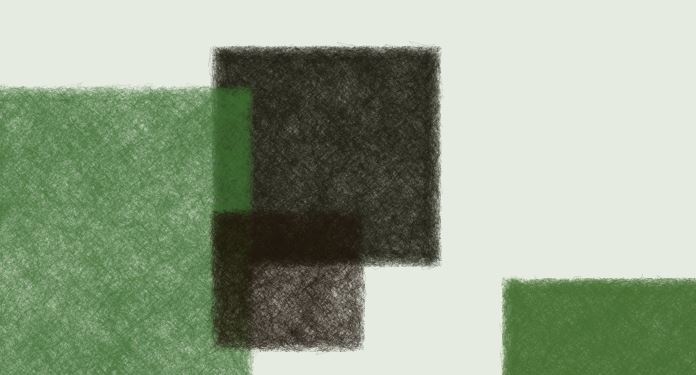
I was particularly interested in the variation in opacity I was able to get from the data, so decided to write another sketch to exploit this further, seen in the diagram above. Here, there is no variation in the length of the bars, but the difference in tone against the dark background has been exaggerated to produce a sort of contour effect.

My visualisations currently have no textual information of course, so arguably have less functional use than the original Google graph. However, in visual form all the raw information is still present, and my goal was to focus on the aesthetics to produce something which could on some level be thought of as an art piece. This was a good learning exercise. It was fascinating to see that when you have the ability to acquire and properly store and retrieve information, it gives you a lot of control over how you present it.

Sketchup & Google Earth

This was an experiment with using 3d modelling tools to recreate artworks and to locate them in a virtual space. I used the freeware 3d modelling software Sketchup (formerly Google Sketchup) to model versions of physical artworks I’d previously made and exhibited. This was a good exercise in getting to grips with Sketchup, which is a pretty powerful and user-friendly tool. I also indulged in a little blue-sky thinking, and fabricated a very large public sculpture too, eventually making an entire outdoor sculpture pavilion for myself!


As Sketchup’s original use was to enable people to upload 3d models of buildings to Google Earth, I was able to preview my work within that environment, all I had to do was provide a location. I decided therefore, to locate my pavilion in the grounds of the world’s tallest building, the Burj Khalifa in Dubai (why the hell not?)


Unfortunately, I was only able to view the work on my local machine, those picky Google Earth people not being inclined to include objects online that don’t actually exist. It was fun though.


Experiments with Programming

In 2013 I was particularly interested in exploring the nature of the decision-making process of making art, and the idea of authorship generally. I began to experiment with allowing aspects  of physical artworks to be generated by chance. I started by throwing dice and using other games of chance to decide the length and directions of various lines I would draw on a wall. Soon I realised that computer programming could be an ideal replacement for this, since it can be programmed to generate randomness, and also seemed to me to provide a more active agent in the decision-making process. I had a few early attempts with applications running an old programming language called BASIC, which I’d played about with as a teenager on an old Sinclair computer.


I was able to generate a few interesting things by setting up loops which would run repeatedly and draw sequences of lines, some of the coordinates being randomized by the computer. I wanted something which would allow me to interact more with and influence what was happening on the screen. I soon discovered Processing, an open-source programming language, and did my best to get to grips with it. I wrote some code which made a grid, and plotted lines from one point to another with each key-press. I had made a similar physical grid on a wall with screws, and used coloured wool to trace the design exactly as the computer directed me.


I was able to change the variables in the code to make the program favour particular regions of the grid, or make diagonals etc.


I later tried to write programs that allowed the user to generate their own imagery, giving them a degree of control over where elements were placed by clicking regions of the screen, but having the computer randomise aspects of the design. This one, for example, would place a rectangle of random dimensions and density where the user left-clicks, while right clicking darkens and partially erases what is already on the screen. The colour is randomly generated from a set number of options, to give a sense of aesthetic consistency.


This was interesting, as the user has a lot of control over aspects of the design, but encounters an element of risk in adding to a composition the they might like. An unexpected shape or colour may throw off the balance of the  work. In this way the interaction with the program becomes a sort of game, with elements of reward and penalty depending on the outcome.


Human or Machine: A Subjective Comparison of Piet Mondrian’s “Composition With Lines’’ (1917) and a Computer Generated Picture

This is a mindmap based on a text published in “The Psychological record” in 1966 by A. Michael Noll, an American computer engineer. Entitled “Human or Machine: A Subjective Comparison of Piet Mondrian’s “Composition With Lines’’ (1917) and a Computer Generated Picture” It describes how he took a famous 1917 painting by Mondrian as a starting point and developed a computer simulation to replicate it. This was then shown to a group of test subjects and their reactions to both the simulation and a reproduction of the original were recorded, with surprising results.

It offers some interesting speculation into the possible working methods of Mondrian at that time, and raises questions about the nature of the artist’s ability to communicate with and provoke an emotional response in the viewer by using purely abstract forms. It also gives a good insight into the state of computer programming and imaging hardware in the 1960s.

Noll's Mondrian Mindmap

A. Michael Noll’s Computer Simulated Mondrian

Recently I began to get interested in using computer programming tools to attempt to replicate paintings from the early Modernist period, particularly those in the style of geometric abstraction. There were a number of reasons for this. Firstly, I have long been a fan of these works, from artists such as Kazimir Malevich, Piet Mondrian and El Lissitzky. Though their works, to the modern eye, may seem a little tame and academic, their departure from any type of representation was at the time truly revolutionary, living as they did through great political and scientific changes in the early part of the 20th century. I was also interested in introducing elements of interactivity into my own artworks, and thought this might allow me to develop some skills to this end. There was also an interest in the general area of trying to somehow codify aesthetics, to see if there was some sort of algorithm for beauty, a question which fascinates me. Also, I was enjoying dicking about with programs to see if I could make them do cool stuff.

"Composition With Lines" (1917) Piet Mondrian
“Composition With Lines” (1917) Piet Mondrian

The first painting I focused my attention on was a famous Mondrian work, Composition With Lines, from 1917. I was advised to try an open-source Java-based animation tool called Processing, and began to work with it. Due to the relative formal simplicity of the painting, I was able to get a passable program working which allowed the user to generate their own version of the artwork by moving the mouse around while holding down a button. (The working interactive sketch is here https://dominicfee.info/uncategorized/albers-simulator/)  With a little research into other attempts to generate historical paintings with coding, I was surprised to find that I had been beaten to it by the American computer engineer A. Michael Noll, by about 50 years. In 1964 he had taken this exact painting and written a computer program to replicate it. Not only that, but according to research he did at the time, the majority of people he surveyed preferred his computer-generated artwork to the Mondrian original. The following pdf explains Noll’s methodology for the project, and draws some subjective comparisons between the genuine and simulated Mondrian paintings.

http://noll.uscannenberg.org/Art%20Papers/Mondrian.pdf

He makes some interesting observations on the fact that the simulated versions contained more randomness in the arrangements of the graphical elements than the genuine artwork as a result of the nature of the programming algorithms used. Despite this, the simulations created a more profound emotional response in the test subjects, causing Noll to speculate on the nature and perceived importance of the artist’s ability to manipulate and affect the emotional state of his audience.

 “Computer Composition With Lines” (1964) A. Michael Noll
“Computer Composition With Lines” (1964) A. Michael Noll


Mondrian Simulator

"Composition With Lines" (1917) Piet Mondrian
“Composition With Lines” (1917) Piet Mondrian

This is an interactive canvas to allow the user to try and simulate the famous Mondrian painting “Composition With Lines” (1917), shown above. Just move the mouse around while pressing the left button. Press a key to start over.